

| Effect | What the evidence shows | Planning use |
|---|---|---|
| Driving and traffic | Sprawl increases vehicle miles traveled. | Judge outlying sites by how many daily trips will need a car, not only by how many lots they yield. |
| Habitat and farmland | Sprawl consumes habitat and farmland. From 1900 to 2000, more than 25% of habitats in U.S. urban regions were lost or fragmented. | Direct growth to infill sites first and keep remaining habitat connected. |
| Public cost | Low-density, car-dependent expansion carries high infrastructure costs per capita. | Compare the cost per household of extending roads and services before approving edge development. |
| Equity | Sprawl can entrench inequities. | Check who can reach jobs and services without owning a car. |
These effects are summarised in the GIS Carta glossary entry on urban sprawl, and the habitat figure comes from MIT’s Terrascope overview.
So what is urban sprawl? It is low-density, car-dependent expansion of urban areas, with separated land uses, leapfrog development and high infrastructure costs per capita, as GIS Carta describes it.
Sprawl is one pattern within the wider discipline covered in what is urban planning. This guide concentrates on what sprawl does to traffic, land and public budgets, then on how zoning and road decisions produce it.
Traffic, commuting and car dependence
Car dependence is the effect most directly tied to sprawl’s form. GIS Carta says sprawl increases vehicle miles traveled, and MIT’s overview lists single-use zoning, low-density residential housing and increased reliance on individual transportation as its usual characteristics. When homes, jobs and shops are separated at low density, most everyday trips are too long to walk and too scattered for frequent transit, so the car becomes the default.
Critics of planning restrictions make a related observation. A Competitive Enterprise Institute study notes that suburbanites, compared with city dwellers, live on larger lots and in larger houses and use automobiles more often. The same study cites a Department of Transportation survey in which the average commute fell from 22.0 minutes in 1969 to 20.7 minutes in 1995.
Those figures do not cancel out. Minutes spent commuting and miles driven are different measures, so a shorter average commute does not show that car use has fallen. Planners should track both, because a household can drive farther and still arrive in about the same time.
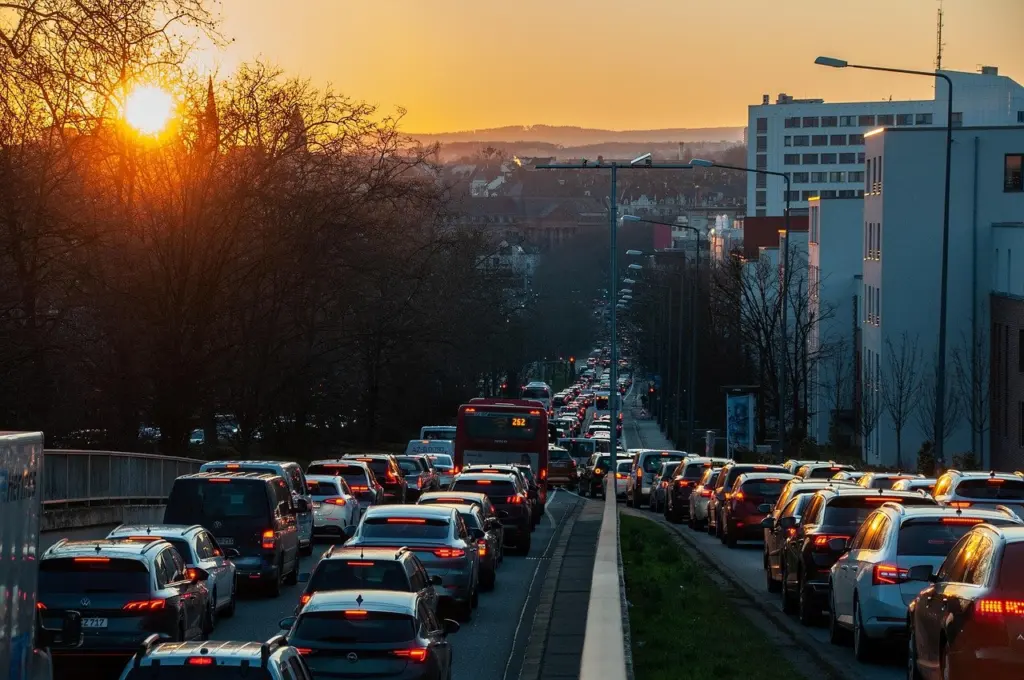
Practical choices that follow from the traffic evidence:
- Count trips, not only travel time. A development that keeps average commute times steady can still add vehicle miles if daily destinations sit farther apart.
- Check transit access before approval. Transit accessibility is one of the standard sprawl indicators, so a site with no realistic service will lock in driving.
- Mix uses near homes. Separated land uses are part of the definition of sprawl, so allowing shops and workplaces near housing is the direct counter.
Land, habitat and farmland
Land consumption is the second major effect, and it takes two forms: outright conversion and fragmentation. MIT’s overview reports that from 1900 to 2000 more than 25% of habitats in U.S. urban regions were lost or fragmented, and notes that single-use developments can displace land previously used by native plants and animals.

Farmland needs a more careful reading. The Competitive Enterprise Institute study cites USDA data showing cropland held constant at 24% of U.S. land from 1945 to 1992, and puts urban uses at about 3%. That national picture does not erase local losses. It does mean a claim that sprawl is consuming the country’s farmland should be tested against regional figures rather than assumed.

The same study raises a caution about the opposite approach. It points to Portland, where parkland per 1,000 residents fell from 21 acres to 19 acres within one decade. Whatever one thinks of the study’s wider argument, the figures are a reminder that compact growth has trade-offs. Infill plans should protect open space as well as add homes.
Infrastructure costs and household effects
The cost effect appears in the definition itself. GIS Carta lists high infrastructure costs per capita among sprawl’s characteristics, which makes sense where roads, pipes and services must stretch across thin, scattered development to reach each household.
For councils, this turns into a screening decision at the approval stage:
- Favour sites next to existing services. Extending networks a short distance serves more households per length of road or pipe than leaping across open land.
- Weigh household transport costs. Larger lots and heavier car use, as the critics’ study describes, move costs from the public budget onto family budgets.
- Treat access as part of cost. Because sprawl can entrench inequities, a cheap-to-build site that residents without cars cannot use is not cheap in practice.
How zoning, roads and leapfrog growth produce sprawl
Sprawl is a result of rules as much as of preference. Single-use zoning keeps housing, shops and workplaces in separate districts. Low-density residential zoning then spreads the housing thinly across those districts. Together they produce the pattern MIT describes, in which individual transportation becomes the practical way to move between uses.

Leapfrog development adds a spatial twist. Building scatters ahead of the built-up edge and leaves undeveloped gaps behind it. The connecting roads and services then have to serve fewer buildings per mile, which is how the high per-capita infrastructure costs arise.
Road policy is the other half of the mechanism. GIS Carta’s summary of remedies stresses coordinating transport with land use. The implication is that road investment and zoning should be reviewed together. New road capacity that opens low-density land for building works against any zoning change meant to concentrate growth.
How sprawl is measured
No single agreed definition exists. The Competitive Enterprise Institute study itself says there is no set definition of urban sprawl and that the concern centres on the impacts and lifestyles of suburban development. Measurement therefore relies on several indicators rather than one number. GIS Carta names these:
- Density. How many people or homes occupy a given area of land, the most common starting point.
- Land-use mix. Whether homes, shops and workplaces sit near each other or in separate districts.
- Block length. Long blocks and disconnected streets make walking and direct routes harder.
- Job-housing balance. Whether jobs and homes are found in the same parts of a region.
- Transit accessibility. How well residents can reach destinations without a car.
Land consumption can be tracked alongside these, as in the habitat and cropland shares above. Use several indicators together. A neighbourhood can look dense and still score badly on land-use mix or transit access.
How communities reduce sprawl
Communities reduce sprawl by combining limits on outward growth with the means to accommodate growth inside the existing area. GIS Carta lists the common policy tools: urban growth boundaries with robust infill capacity, mixed-use and higher-density zoning near transit, and priced parking. It also calls for coordinating transport with land use.
- Urban growth boundaries. A boundary limits outward expansion, but it only works if infill capacity exists inside it. Without that capacity, pressure shifts to prices or to development beyond the line.
- Mixed use and density near transit. This suits corridors that already have, or are planned to have, frequent service. What is transit oriented development covers how that works around stations.
- Priced parking. Charging for parking addresses the large parking areas that car-oriented layouts require and nudges trip choices.
- Habitat links where growth has already fragmented land. Singapore’s Eco-Link@BKE wildlife corridor, which MIT cites, connects the Bukit Timah Nature Reserve and the Central Catchment Nature Reserve.
These tools tend to be grouped under the broader framework in what is smart growth. Start with the boundary and infill rules if the problem is outward expansion, and with zoning and parking if the problem is car dependence inside the built area.
Frequently asked questions
Can sprawl affect equity as well as the environment?
Yes. GIS Carta states that sprawl can entrench inequities alongside increasing vehicle miles traveled and consuming habitat and farmland.
What is habitat fragmentation?
It is the process by which large patches of native vegetation are broken into small, isolated patches, according to MIT’s overview.
Does single-use zoning affect wildlife?
It can. MIT notes that single-use spaces can take up land previously used as habitat for native flora and fauna.